Welcome to the Course!
Readings for 2/15 went up a bit late--but they are there now!
I've been thinking about a "big" question, too. What is a course?
The Core of ITP
Posted in After Class Discussion.
Enter your password to view comments.
– April 6, 2011
I have been trying to get into the classroom to teach mathematics as some of my colleagues in general education have the opportunity to; however this has been quite a challenge. Being able to teach mathematics is a class would have allowed me to properly implement my project and monitor it but it has been unfeasible. My responsibilities as an administrator for a school with approximately 70% of its students who are alternatively assessed have derailed my focus on working with students in mathematics using photography.
I initially wanted to execute this project because I was awarded a grant two semesters ago to conduct research in teaching mathematics in special education classrooms using photography. My initial challenge with the research was with students’ attendance; many of my students are transient. Acquiring signatures from parents and the students, which was compulsory was my second challenge. The lack of permission from parents to allow data collection using video recording and student attendance limited my research interest. With this class assignment in mind, I wanted to have a second chance at collecting data by developing and implementing my project, however this will not be possible at this time. My goal is to continue with my research analyzing and revamping my research methodology.
To that end, I want to refocus my project for this course on my primary duty in providing professional development. The project will focus on using video-based professional development to enhance teaching and learning. I have been working with two teachers since the last academic year using video recordings to document classroom interactions/instruction rather than providing formal and informal observations.
I prefer this type of collaborative observation instead of the traditional method of telling teachers how to teach. Additionally, both teachers I am working with feel comfortable with this process because they are able to review their pedagogical practices, reflect and have engaged discourses about improving their own practices. This year, the teachers chose to continue with this video-based professional development and decided to invite one more teacher. To document instructional practices, teachers are provided flip cameras to record while teaching and they upload it into a shared file suing Drop box. We later review the videos, answer questions regarding our observations and provide constructive critiques.
The goal of my project is to continue to use this method, document the trajectory of the teacher’s professional development and introduce this process to the entire school (or at least my Academy) and have an open discourse about best practices.
Posted in Project Concepts.
rev="post-431" 1 comment
– April 5, 2011
Posted in Project Concepts.
Comments Off on Protected: Project Update
– April 5, 2011
My own use of the laptop/projector/screen has been primarily for student presentations or to access an online discussion board or demonstrate how to use one in front of the class. My use of gadgets in the classroom is thus primarily for presentation purposes, and it is structured to, ideally, demand attention to one part of the room. While I do allow laptops in the classroom for notetaking, in other words, I am still not entirely sure how I would structure lessons to make use of decentralized gadgets (like a smart phone or iPad) in a way that would encourage engagement over distraction, particularly in courses with more than 25 students. I am thus curious as to whether and how others allow students to use their own handheld gadgets throughout the classroom to a collective end.
This article in The Chronicle of Higher Education, “iPads Could Hinder Teaching,” for example, not only cites the disadvantages of the iPad as a classroom distraction, but also suggests how this particular gadget might be used by individual students to increase interactivity in larger courses. This article also raises the issue of how much the structure of a gadget determines its pedagogical value. For example, because iPads make it harder to hide “web browsing,” as the article suggests, they are potentially a more useful tool than a laptop. What is/would be the ideal “gadget” for your courses?
Beyond these pragmatic student distraction/engagement questions, the use of “gadgets” raises fundamental questions about how we define literacy and how such “gadgets” might influence (to gesture just a little bit toward Marshall McLuhan’s technodeterminism) how we process ideas in reading and writing. The question of whether students might read more (or better?) with e-readers, for example, is one driving inquiry in a recent CUNY grant project. How much does the “medium” determine the “message” with a text, for example? Returning to Chris Stein’s incredibly helpful post on the “Digital Media Lifecycle,” furthermore, how does the movement from sensory input to sensory output through the digital influence student involvement with course material (if at all)? The technological alienation from the “human” has been a question haunting this course, and I wonder how others perceive the influence of digital “gadgets” here? Furthermore, how might the discipline influence the extent to which there is a deviation between the “live” and the digital? For example, I would imagine that Chad would certainly acknowledge a big difference between a live performance and an mp3 file. However, as a composition and lit. instructor, I actually cannot say that I would find nearly as immense a qualitative difference between any analog edition of text and the same e-text. How does discipline, in other words, determine the role gadgets play in your classroom?
Posted in Motivation.
Comments Off on Gadgetry and Pedagogy
– April 4, 2011
In anticipation of our look at gadgets on Tuesday I’m writing this post on how digital media is created stored and played. There’s not enough room to get into full details so this is just a kind of birds eye view. What I’ll cover is how we go from a natural stimulus, like sound or light, to represenation of the stimulus being presented through a deveice like speakers or a monitor. The name we’ll use for this process is the Digital Media Lifecycle.
Here is a kind of simple diagram of the process:

Diagram of the digital media lifecycle. Drawn by Jody Culkin
And here is a PDF that my colleague Jody Culkin, @jodyc, also a professor in Media Arts & Technology at BMCC, created. Rather she created, she’s an artist, and I helped with the writing.
I’ll run through each phase relatively quickly here.
It all starts with the senses. There are a lot of natural phenomena in the world but when it comes to creating digital media we are only intersted in approximating those that we can sense. Even narrower, most media deals with only two senses, sight and hearing. There is work being done on taste, touch and smell but we will ignore them for now.
Quick refresher here (many of the details left out so forgive me scientists), we see through our eyes which focus light onto the retina. The retina is sensitive (through rods and cones) to certain wavelengths of light and to the intensity of the light. Signals are sent from the cones and rods through the optic nerve to our brains which interpret them as color and brightness.
We hear though our ears which have little pieces (the eardrum and three bones actually) that move when sound waves strike them. These movements translate into signals that are sent through the optic nerve to our brains which interpret them as sound (and all sorts of things related to sound like tone, timbre, and direction by comparing both ears, ). Two important pieces for our purposes today are how loud the sound is and the pitch.
vision (and add for lasik but compares eye to camera): http://www.lasikplus.com/lasik/how-eye-works
hearing: http://www.deafnessresearch.org.uk/How%20the%20ear%20works+1974.twl
So the two stimuli that go along with sight and hearing are light and sound. We will narrow that down further to visible light and sound between 20Hz and 20,000Hz because that is all that humans can sense. (Hz is generic and stands for cycles per second. It can apply to any cyclical or periodical phenomenon. To apply that to sound, we hear sound where the waves are vibrating at 20 to 20,000 times per second, with the faster vibrations sounding higher in pitch). Again, narrowing down for these purposes, we are interested in the wavelength of the light because that is what we see as color and for sound we are interested in amplitude of the sound wave which we hear as loudness and the frequency of the sound waves which we hear as pitch.
sound: http://www.physicsclassroom.com/class/sound/u11l1c.cfm, http://www.fearofphysics.com/Sound/dist.html
light: http://www.physicsclassroom.com/class/light/u12l2a.cfm
To begin the process of digitization we need instruments, inputs, that are sensitive to light and sound. Starting with sound we have the microphone. Essentially a microphone works very much like the ear. There is a part of it which is very sensitive to sound waves called the diaphragm. When the diaphragm moves its movements are translated into an electrical signal. Some microphones need power to make the diaphragm work and generate the electrical signal. They can use everything from a battery to what is called phantom power on more professional microphones.
Digital cameras, similar to our eyes, have two basic parts to capture light. The first part is the lens which focuses the light and the second part is the sensor. Simplifying things a bit (there are many kinds of sensors) each sensor in a digital camera is actually made up of millions of little sensors. This is what is meant when you hear about megapixels in cameras. The number refers to how many little light sensors the camera has. Each sensor is only sensitive to a particular wavelength of light. A typical example is a sensor where the little sensors are only sensitive to red, green or blue light. In addition to the wavelength the sensors are also sensitive to the amount of light that hits them. So when the shutter opens each little sensor transmits an electronic signal that corresponds to the amount of red, green or blue light that is hitting it. To make up for the fact that each sensor can only sense one wavelength of light they are arrayed in an alternating checkerboard-like pattern.
Before we go on it should be noted that, based on the limitations of the input devices, different (sometimes more, usually less) information is being captured than what humans get from direct exposure to the stimuli.
Gadgets: http://electronics.howstuffworks.com/electronic-gadgets-channel.htm
digital audio (lots of info):http://www.mediacollege.com/audio/
microphone: http://www.mediacollege.com/audio/microphones/how-microphones-work.html
different types of microphones: http://electronics.howstuffworks.com/gadgets/audio-music/question309.htm
Cameras: http://electronics.howstuffworks.com/cameras-photography-channel.htm, http://www.explainthatstuff.com/insidedigitalcamera.html,
Nice 3 min video on digital camera:http://electronics.howstuffworks.com/cameras-photography/digital/question362.htm
Now we have an electrical signal from the microphone and one from the sensor array and we need to translate this into something computers can understand, namely binary numbers. To do this some kind of Analog-to-Digital Converter (ADC) is used. This is a computer component and can either be integrated into a device, like on a video camera, or a separate part of a computer, like a sound or video card.
There are two basic steps to the process. The first step is sampling. This is just looking at the electrical signal at a given point. The next step is quantizing, turning the signal at the sampling point into a binary number.
Sound is time based so the samples must be taken at frequent intervals, called the sampling rate. A man named Nyquist figured out that to accurately reproduce a wave you have to sample it at twice the frequency of the wave (basically so you get both the peak and trough of the wave). Because we can hear sound at 20,000Hz the sampling rate needs to be set to at least 40,000Hz. CD quality audio does it at 44,100Hz. Nowadays most systems use even higher sampling rates.
Next is quantizing; turning every sample into a number. Because this is for computers we translate to binary numbers. Binary numbers are just 1’s and 0’s like 100010. Each of those digits is called a bit. To make the process simpler each sample is recorded with the same number of bits. So even if the sample is only the number two (10 in binary), it might be recorded like this 00000010. The number of bits used for each sample is important for two reasons. One is that it sets a hard limit on how many different levels of sound can be recorded, and secondly it determines how much storage each sample will need (more bits more storage). The number of bits used is called bit depth. CD audio records at 16 bits per sample (65,536 different possible sound values).
As expected more bits produces higher fidelity (trueness to original sound) in the digital file, and so does a higher sampling rate (up to a point). You might be interested to know that telephone audio is often around 8,000Hz sampling rate and 8 bits per sample. Which is why you can hear people fine but music sounds awful on the phone.
For light the samples are the measurements from each of the many little sensors. In effect the sensors are sampling the light. In this way you can think of the megapixels like the sampling rate. Again each sample must be quantized. The problem here is that each sensor only gave us information one color (red, green or blue). I’ll skim some detailed explanation that I admittedly don’t fully understand myself to say that mathematical formulas are used to estimate the actual light reading for each sensor based on the reading from the sensor and the sensors around it. The resulting color is qusually quantized by giving values for the amount of red, green and blue light. Each color is given 8 bits for 24 total bits. Higher-end cameras now offer the option to store what is called a raw image file that usually has more bits.
Video cameras do both of the above using a microphone to record audio and image sensors to record a series of pictures.
Interactive Sampling Rate and Bit Depth explorer (requires Java): http://www.cse.ust.hk/learning_objects/audiorep/aurep.html
Descriptions of Sampling Rate and Bit Depth
http://wiki.audacityteam.org/index.php?title=Sample_Rates
http://wiki.audacityteam.org/index.php?title=Bit_Depth
Now that the information has been sampled and quantized we have to store then numbers in a file. Most digital files are basically just all of the quantized numbers with a bit of meta data added to tell the computer what kind of file it is.
Where the trickiness and all of the different file formats come in is usually from compression. Looking back remember that CD audio records 44,100 samples per second. That’s a lot of samples and a lot of data. Compression (whether for sound or images) attempts to reduce the data. Lossless compression reduces the amount of data stored without losing any data and lossy compression throws out some of the data to reduce the size. MP3 is an example of lossy compression that manages to reduce file size to 1/10 or so of CD quality audio. Video is even worse as it has both audio and a bunch of images (usually in the range of 20-60 per second). Pretty much all video you see has been compressed. Getting into file formats fully would take too long but here are some of the common formats for audio images and video.
Audio: wav, aiff, mp3
Images: jpeg, png, gif, tiff (and RAW which is actually a bunch of formats)
Video: avi, mpeg, mov, wmv, m4v (and these don’t include many formats used for DVD, Blu-Ray and various video editing systems)
When it comes time to play one of these digital media files that have been created we now need to do the reverse process of the ADC and use a Digital to Analog Converter (DAC) to reproduce the analog sound. Like the ADC the DAC can be built into a device or part of a computer. There is a lot of math here and the quality of the algorithms and hardware used in this part of the process can greatly affect the sound.
The newly analog signal is then sent to something that can turn it back into stimuli we can hear or see. Speakers do this for sound. Basically speakers are just pieces of material that vibrate back and forth in time with the frequency and amplitude of the recorded sound and recreate the original sound waves. Images are sent to monitors that hav little lights that shine and reproduce the light (the monitor resolutions are also measured in pixels).
And finally we see or hear the light and sound again, hopefully still something like it was at the beginning of the whole process.
Posted in Weekly Readings.
rev="post-411" 1 comment
– April 4, 2011
I finally remembered the name of the hosting company which offers web hosting at no charge for K-12 schools (public).
It’s lunarpages.
It’s been quite a while since I last checked it out, but they’re still making the offer, and when I looked into it before, it was definitely not a scam.
If you’re working in k12, and want to get something set up, this might be a good alternative.
Posted in Uncategorized.
rev="post-406" 1 comment
– April 3, 2011
Hi all,
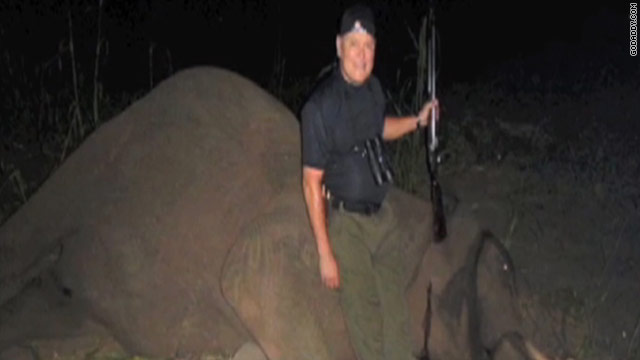
This is completely random, but I figure I’d put it out there, since some of us are looking for cheap web hosting. It’s an article about the founder of GoDaddy’s Elephant hunting trip. I found the following line to be the most revolting: “The footage, shot March 8, shows him hunting an elephant on a farm and posing with a shotgun beside its corpse.” I’ll pay a bit more for people who don’t shoot defenseless elephants for sport.
Cheers,
Joost
Posted in After Class Discussion.
rev="post-401" 1 comment
– April 1, 2011
Sorry for the last minute announcement, but I thought some of you might be interested in the BMCC Day of Technology event that is taking place tomorrow. I will be there from 10:30 to 12:30, and our professor, Chris Stein, is presenting! Here is the info:
http://www.bmcc.cuny.edu/techday/agenda.jsp
Breakout Sessions
9:00am–10:00am Registration and breakfast
Richard Harris Terrace
10:00am–10:15am Welcome from Academic Affairs
10:15am–10:45am Plenary Speaker & Discussion Facilitator: Janey Flanagan
11:00am–11:30am Breakout I: One Connection at a Time: Utilizing Social Media
Kim Chu
Breakout II: E-Learning Student Feedback Panel
Claire Pamplin
11:35am–12:05pm Breakout I: Research Perspectives: Discussions in Online Math and Science
Kathleen Offenholley
Breakout II: Reclaiming Fun: the Function of Ludic Learning at the Present Time
Carlos Hernandez & Joshua DeBonis
12:10pm–1:00pm Lunch
1:00pm–2:00pm Keynote address from Michael Graham Moore
E-Learning Horizons: Far and Near
Theatre II
2:10pm–2:40pm Breakout I: How to Motivate Online Discussion: Two Perspectives
Mahatapa Palit & Michelle Wang
Breakout II: Connecting through the CUNY Academic Commons: A Case Study
Tom Means
2:45pm–3:15pm Breakout I: Use Wikis to Enhance Student’s Science Literacy
Ling Chen
Breakout II: Understanding Student Teachers’ Perceptions of Learning with e-Portfolios
Jean-Yves Plaisir
3:20pm–3:50pm Breakout I: Using Online Exams Through Blackboard: Advantages and Disadvantages
David Krauss
Breakout II: Creating an Online Community for E-Learning Students
Lana Callender, Allana Hankey-Thomas & Rebecca Li
3:55pm–4:25pm Breakout I: Using E-Learning Strategies to Streamline Multi-course Instruction
Vernon Smith
Breakout II: Going Green: Teaching Face-to-Face with Paperless Technology
Michelle Martin
4:30pm Drawing for Prizes
Posted in Uncategorized.
rev="post-397" 1 comment
– March 30, 2011
Posted in Uncategorized.
Comments Off on Protected: Flipteaching
– March 29, 2011
Posted in Motivation.
Comments Off on Protected: Future of the Textbook: smARThistory.org
– March 28, 2011
